Design Principles
The vis framework has a simple design: write an analyzer to make an analytic judgment about a piece, then use the built-in models to ensure analyzers are run in the right order, with the right inputs and settings. Since music analysis is a complex task (really, a complicated complex of tasks), and the vis framework is highly abstracted, our simple design requires much explanation.
Write an Analyzer
There are two types of analyzers: indexers and experimenters. Indexers take a music21.stream.Score or the result of another indexer, perform a calculation, then produce output that can sensibly be attached to a specific moment of a piece. Indexers may be relatively simple, like the IntervalIndexer, which accepts an index of the notes and rests in a piece and outputs an index of the intervals between all possible part pairs. Indexers may be complicated, like the NGramIndexer, which accepts at least one index of anything, and outputs an index of successions found therein. An indexer might tell you the scale degrees in a part, or the harmonic function of chords in a score.
Experimenters always accept the result of an indexer or another experimenter, perform a culculation, then produce results that cannot be sensibly attached to a specific moment of a piece. Experimenters may be relatively simple, like the FrequencyExperimenter, which accepts any index and counts the number of occurrences of unique objects found within. Experimenters may be complicated, like one that accepts the result of the FrequencyExperimenter, then outputs a Markov transition model.
The vis framework ships analyzers for various tasks, but we think most users will extend the framework with their own analyzers.
Use a Model
The vis framework has two data models. Use IndexedPiece for a single piece and AggregatedPieces for pieces as a group. In a typical application, you will write analyzers but never use them directly, and never modify but always use the models. The models know how to run analyzers on the piece or pieces they hold, how to import pieces safely and efficiently, and how to find and access metadata. In the future, the models may support storing results from analyzers in a database so they need not be recalculated for future analyses, use multiprocessing to speed up analyses on multi-core computers, or facilitate transit to and from analyzers in other languages like Haskell. We recommend you use the models to benefit from new features without modifying your programs, since they (should not) change the API.
How to Start
After you install the framework, we recommend you begin with the two tutorials below (refer to Tutorial: Make a new Workflow and Tutorial: Use the WorkflowManager). When you wish to write a new analyzer, refer to the documentation and source code for the TemplateIndexer and TemplateExperimenter.
Install and Test the Framework
Install for Deployment
You must install the VIS Framework before you use it. If you will not write extensions for the Framework, you may use pip to install the package from the Python Package Index (PyPI—https://pypi.python.org/pypi/vis-framework/). Run this command:
$ pip install vis-framework
You may also wish to install some or all of the optional dependencies:
numexprandbottleneck, which speed uppandas.openpyxl, which allowspandasto export Excel-format spreadsheets.cythonandtables, which allowpandasto export HDF5-format binary files.
You may install optional dependencies in the same ways as VIS itself. For example:
$ pip install numexpr bottleneck
Install for Development
If you wish to install the VIS Framework for development work, we recommend you clone our Git repository from https://github.com/ELVIS-Project/vis/, or even make your own fork on GitHub. You may also wish to checkout a particular version for development with the “checkout” command, as git checkout tags/vis-framework-1.2.3 or git checkout master.
If you installed git, but you need help to clone a repository, you may find useful information in the git documentation.
After you clone the vis repository, you should install its dependencies (currently music21, pandas, and mock), for which we recommend you use pip. From the main VIS directory, run pip install -r requirements.txt to automatically download and install the library dependencies as specified in our requirements.txt file. We also recommend you run pip install -r optional_requirements.txt to install several additional packages that improve the speed of pandas and allow additional output formats (Excel, HDF5). You may need to use sudo or su to run pip with the proper privileges. If you do not have pip installed, use your package manager (the package is probably called python-pip—at least for users of Fedora, Ubuntu, and openSUSE). If you are one of those unfortunate souls who uses Windows, or worse, Mac OS X, then clearly we come from different planets. The pip documentation may help you.
During development, you should usually start python (or ipython, etc.) from within the main “vis” directory to ensure proper importing.
After you install the VIS Framework, we recommend you run our automated tests. From the main vis directory, run python run_tests.py. Python prints . for every test that passes, and a large error or warning for every test that fails. Certain versions of music21 may cause tests to fail; refer to Known Issues and Limitations for more information.
The WorkflowManager is not required for the framework’s operation. We recommend you use the WorkflowManager directly or as an example to write new applications. The vis framework gives you tools to answer a wide variety of musical questions. The WorkflowManager uses the framework to answer specific questions. Please refer to Tutorial: Use the WorkflowManager for more information. If you will not use the WorkflowManager, we recommend you delete it: remove the workflow.py and other_tests/test_workflow.py files.
Install R and ggplot2 for Graphs
If you wish to produce graphs with the VIS Framework, you must install an R interpreter and the “ggplot2” library. We use the version 3.0.x series of R.
If you use a “Windows” or “OS X” computer, download a pre-compiled binary from http://cran.r-project.org. If you use a “Linux” computer (or “BSD,” etc.), check your package manager for R 3.0.x. You may have a problem if you search for “R,” since it is a common letter, so we recommend you assume the package is called “R” and try to search only if that does not work. If your distribution does not provide an R binary, or provides an older version than 3.0.0, install R from source code: http://cran.r-project.org/doc/manuals/r-release/R-admin.html.
In all cases, if you encounter a problem, the R manuals are extensive, but require careful attention.
Your distribution may provide a package for “ggplot” or “ggplot2.” The following instructions work for all operating systems:
Start R (with superuser privileges, if not on Windows).
Run the following command to install ggplot:
install.packages("ggplot2")
Run the following commands to test R and ggplot:
huron <- data.frame(year=1875:1972, level=as.vector(LakeHuron))
library(plyr)
huron$decade <- round_any(huron$year, 10, floor)
library(ggplot)
h <- ggplot(huron, aes(x=year))
h + geom_ribbon(aes(ymin=level-1, ymax=level+1))
Expect to see a chart like this:
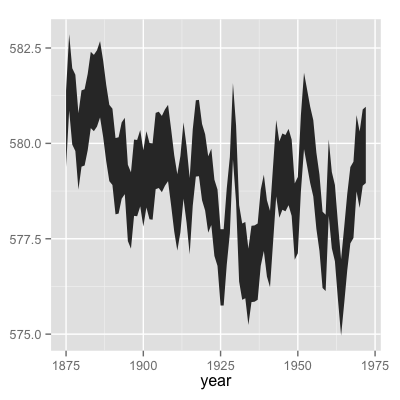
Image credit: taken from the “ggplot2” documentation on 26 November 2013; reused here under the GNU General Public License, version 2.
Quit R. You do not need to save your workspace:
q()
Known Issues and Limitations
- Issue: music21 releases earlier than specified in our
requirements.txtfile may contain bugs that cause some of our automated tests to fail. We recommend you use a music21 release from the 1.7.x series. In particular, we do not recommend versions 1.5.0 or 1.6.0. - Issue: Additionally, music21 releases later than 1.7.1 have not been tested. We do not recommend using music21 1.8.0 or later until after the VIS Framework 2.0 release.
- Limitation: By default, the vis framework does not use multiprocessing at all. If you install the optional packages for pandas, many of the pandas-based indexers and experimenters will use multi-threading in C. However, there are many opportunities to use multiprocessing where we have yet to do so. While we initially planned for the indexers and experimenters to use multiprocessing, we later decided that the high overhead of multiprocessing in Python means we should leave the multiprocessing implementation up to application developers—the realm of the
WorkflowManager. - Limitation: This is a point of information for users and developers concerned with counterpoint. The framework currently offers no way to sensitively process voice crossing in contrapuntal modules (“interval n-grams”). “Higher” and “lower” voices are consistently presented in score order. We have planned for several ways to deal with this situation, but the developer assigned to the task is a busy doctoral student and a novice programmer, so they have not been fully implemented yet.
Tutorial: Make a new Workflow
Once you understand our framework’s architecture (explained in Design Principles), you can start to design a new workflow to ask your own queries.
Develop a Question
Pretend you are me. I want to describe what distinguishes the melodic styles of two composers. I have already chosen the composers and the pieces I will use to compare them, trying to make the test sets as similar as possible except for the different composers. I want to use the vis framework, and I want to be as lazy as possible, so I will try to avoid adding new analyzers.
For my preliminary investigation, I will consider only patterns of melodic motion, since all required indexers and experimenters are already included with the vis framework. The NGramIndexer provides vis with pattern-finding functionality, so to run my query I must consider two questions: (1) what does the NGramIndexer need in order to find melodic patterns? and (2) how shall I aggregate the melodic patterns across pieces?
After the preliminary investigation, I would make my query more useful by using the “horizontal” and “vertical” functionality of the NGramIndexer to coordinate disparate musical elements that make up melodic identity. Writing a new Indexer to help combine melodic intervals with the duration of the note preceding the interval would be relatively easy, since music21 knows the duration of every note. A more subtle, but possibly more informative, query would combine melodic intervals with the scale degree of the preceding note. This is a much more complicated query, since it would require an indexer to find the key at a particular moment (an extremely complicated question) and an indexer that knows the scale degree of a note.
What Does the NGramIndexer Require?
I start by reading and understanding the documentation for the NGramIndexer. This indexer’s power means it can be difficult to use in subtle and unexpected ways. For this simple preliminary investigation, we need only provide the melodic intervals of every part in an IndexedPiece. The melodic intervals will be the “vertical” events; there will be no “horizontal” events. We can change the “mark singles” and “continuer” settings any time as we please. We will probably want to try many different pattern lengths by changing the “n” setting. If we do not wish our melodic patterns to include rests, we can set “terminator” to [u'Rest'].
Thus the only information NGramIndexer requires from another analyzer is the melodic intervals, produced by HorizontalIntervalIndexer, which will confusingly be the “vertical” event. As specified in its documentation, the HorizontalIntervalIndexer requires the output of the NoteRestIndexer, which operates directly on the music21 Score.
The first part of our query looks like this:
1 2 3 4 5 6 7 8 9 10 11 12 13 14 15 | from vis.analyzers.indexers import noterest, interval, ngram
from vis.models.indexed_piece import IndexedPiece
# prepare inputs and output-collectors
pathnames = [list_of_pathnames_here]
ind_ps = [IndexedPiece(x) for x in pathnames]
interval_settings = {'quality': True}
ngram_settings = {'vertical': 0, 'n': 3} # change 'n' as required
ngram_results = []
# prepare for and run the NGramIndexer
for piece in ind_ps:
intervals = piece.get_data([noterest.NoteRestIndexer, interval.HorizontalIntervalIndexer], interval_settings)
for part in intervals:
ngram_results.append(piece.get_data([ngram.NGramIndexer], ngram_settings, [part])
|
After the imports, we start by making a list of all the pathnames to use in this query, then use a Python list comprehension to make a list of IndexedPiece objcects for each file. We make the settings dictionaries to use for the interval then n-gram indexers on lines 7 and 8, but note we have not included all possible settings. The empty ngram_results list will store results from the NGramIndexer.
The loop started on line 12 is a little confusing: why not use an AggregatedPieces object to run the NGramIndexer on all pieces with a single call to get_data()? The reason is the inner loop, started on line 14: if we run the NGramIndexer on an IndexedPiece once, we can only index a single part, but we want results from all parts. This is the special burden of using the NGramIndexer, which is flexible but not (yet) intelligent. In order to index the melodic intervals in every part using the get_data() call on line 15, we must add the nested loops.
How Shall I Aggregate Results?
For this analysis, I will simply count the number of occurrences of each harmonic interval pattern, which is called the “frequency.” It makes sense to calculate each piece separately, then combine the results across pieces. We’ll use the FrequencyExperimenter and ColumnAggregator experimenters for these tasks. The FrequencyExperimenter counts the number of occurrences of every unique token in another index into a pandas.Series, and the ColumnAggregator combines results across a list of Series or a DataFrame (which it treats as a list of Series) into a single Series.
With these modifications, our program looks like this:
1 2 3 4 5 6 7 8 9 10 11 12 13 14 15 16 17 18 19 20 21 22 23 | from vis.analyzers.indexers import noterest, interval, ngram
from vis.analyzers.experimenters import frequency, aggregator
from vis.models.indexed_piece import IndexedPiece
from vis.models.aggregated_pieces import AggregatedPieces
from pandas import DataFrame
# prepare inputs and output-collectors
pathnames = [list_of_pathnames_here]
ind_ps = [IndexedPiece(x) for x in pathnames]
interval_settings = {'quality': True}
ngram_settings = {'vertical': [0], 'n': 3} # change 'n' as required
ngram_freqs = []
# prepare for and run the NGramIndexer
for piece in ind_ps:
intervals = piece.get_data([noterest.NoteRestIndexer, interval.HorizontalIntervalIndexer], interval_settings)
for part in intervals:
ngram_freqs.append(piece.get_data([ngram.NGramIndexer, frequency.FrequencyExperimenter], ngram_settings, [part]))
# aggregate results of all pieces
agg_p = AggregatedPieces(ind_ps)
result = agg_p.get_data([aggregator.ColumnAggregator], [], {}, ngram_freqs)
result = DataFrame({'Frequencies': result})
|
The first thing to note is that I modified the loop from the previous step by adding the FrequencyExperimenter to the get_data() call on line 18 that uses the NGramIndexer. As you can see, the aggregation step is actually the easiest; it simply requires we create an AggregatedPieces object and call its get_data() method with the appropriate input, which is the frequency data we collected in the loop.
On line 22, result holds a Series with all the information we need! To export your data to one of the supported formats (CSV, Excel, etc.) you must create a DataFrame and use one of the methods described in the pandas documentation. The code on line 23 “converts” result into a DataFrame by giving the Series to the DataFrame constructor in a dictionary. The key is the name of the column, which you can change to any value valid as a Python dictionary key. Since the Series holds the frequencies of melodic interval patterns, it makes sense to call the column 'Frequencies' in this case. You may also wish to sort the results by running result.sort() before you “convert” to a DataFrame. You can sort in descending order (with the most common events at the top) with result.sort(ascending=False).
Tutorial: Use the WorkflowManager
The script developed in Tutorial: Make a new Workflow is suitable for users comfortable with an interactive Python shell. Application developers making a graphical interface—whether on the Web or in a desktop application—can take advantage of a further layer of abstraction offered by our WorkflowManager. Since developers often prefer to separate their user interface code from any of the so-called “business logic,” the WorkflowManager provides the means by which to connect the “dumb” user interface with the highly-abstracted vis framework. You can think of the WorkflowManager as the true back-end component of your application, and you should expect to rewrite it with every application you develop.
The WorkflowManager‘s documentation describes its functionality:
-
class
vis.workflow.WorkflowManager(pathnames)[source] Parameters: pathnames (list or tuple of basestring or IndexedPiece) – A list of pathnames.The
WorkflowManagerautomates several common music analysis patterns for counterpoint. Use theWorkflowManagerwith these four tasks:load(), to import pieces from symbolic data formats.run(), to perform a pre-defined analysis.output(), to output a visualization of the analysis results.export(), to output a text-based version of the analysis results.
Before you analyze, you may wish to use these methods:
metadata(), to get or set the metadata of a specificIndexedPiecemanaged by thisWorkflowManager.settings(), to get or set a setting related to analysis (for example, whether to display the quality of intervals).
You may also treat a
WorkflowManageras a container:>>> wm = WorkflowManager(['piece1.mxl', 'piece2.krn']) >>> len(wm) 2 >>> ip = wm[1] >>> type(ip) <class 'vis.models.indexed_piece.IndexedPiece'>
Port a Query into the WorkflowManager
If I want to port the Tutorial: Make a new Workflow query to the WorkflowManager, I need to fit its functionality into the existing methods. The load(), output(), and export() methods are all related to preparing IndexedPiece objects for analysis and saving or outputting results. Since my query requires no special treatment in these areas, I will not modify those methods, and all of my changes will be in the run() method.
Since my new program only requires one query, I can make a very simple run() method and remove the other hidden methods (_intervs(), _interval_ngrams(), _variable_part_modules(), _two_part_modules(), and _all_part_modules()). Of course, you may wish to use those methods for inspiration when you build your own queries. When I add my new query’s logic to the run() method, I get this:
1 2 3 4 5 6 7 8 9 10 11 12 13 14 15 16 17 | def run(self):
ngram_settings = {'vertical': [0], 'n': self.settigns(None, 'n')}
ngram_freqs = []
for i, piece in enumerate(self._data):
interval_settings = {'quality': self.settings(i, 'interval quality')}
intervals = piece.get_data( \
[noterest.NoteRestIndexer, interval.HorizontalIntervalIndexer], \
interval_settings)
for part in intervals:
ngram_freqs.append( \
piece.get_data([ngram.NGramIndexer, frequency.FrequencyExperimenter], \
ngram_settings, \
[part]))
agg_p = AggregatedPieces(ind_ps)
self._result = agg_p.get_data([aggregator.ColumnAggregator], [], {}, ngram_freqs)
|
I made the following changes:
- Remove the
instructionparameter fromrun(), since there is only one experiment. - Use the
importstatements at the top of the file. - Use
self._datarather than building my own list ofIndexedPieceobjects (inenumerate()on line 5). - Set
interval_settingsper-piece, and use the value from built-inWorkflowManagersettings. - Set
nfrom the built-inWorkflowManagersettings.
I could also use the WorkflowManager.settings() method to get other settings by piece or shared across all pieces, like 'simple intervals', which tells the HorizontalIntervalIndexer whether to display all intervals as their single-octave equivalents.
To run the same analysis as in Tutorial: Make a new Workflow, use the WorkflowManager like this:
1 2 3 4 5 6 7 8 9 | from vis.workflow import WorkflowManager
pathnames = [list_of_pathnames]
work = WorkflowManager(pathnames)
work.load('pieces')
for i in xrange(len(work)):
work.settings(i, 'quality', True)
work.run()
work.export('CSV', 'output_filename.csv')
|
This script actually does more than the program in Tutorial: Make a new Workflow because export() “converts” the results to a DataFrame, sorts, and outputs the results.